15 - Kemm skinadurel
✏️ This explanation does not yet exist in your language. Please fill this Google Form if you want to help us!
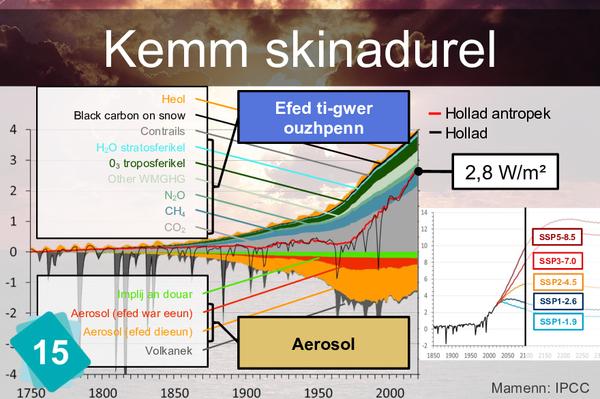
Together with the coccolithophores, this card is the one that impresses the players the most. It is important to explain it well. One way to play it down is to say that Radiative Forcing is just a measurement. The Earth receives energy from the Sun and radiates it back to space in the form of infrared rays. It should be in a state of thermal equilibrium and the average temperature should be constant. Anything that causes the Earth to move away from this thermal equilibrium, whether natural (sun, volcanoes) or anthropogenic (aerosols, GHGs), is called radiative forcing. Caution: the definition has been simplified for educational purposes. A rigorous definition would be as follows: "Radiative forcing is the measure of the imbalance between the energy that arrives every second on Earth and the energy that would leave if the temperature had remained fixed since 1750". As the earth's temperature has risen in the meantime, the delta between instantaneous heat exchanges has decreased. Similarly, in 2050, in the RCP2.6 scenario, the forcing will be 2.6 W/m2, but the temperature will have stabilised, meaning that the delta between incoming and outgoing energy will be zero. On the main graph, we can see the different components of the radiative forcing: in the upper part, the warming effects in the lower part, the cooling effects. The greenhouse effect (CO2 + Other WMGHG + Trop O3) represents a positive forcing of 3.1 W/m2. It is therefore in the upper part of the graph. Aerosols (Aer - Rad Int. + Aer - Cld Int.) have a cooling effect and are therefore in the lower part of the graph. For more details on this graph, see the Radiative Forcing fact sheet. The secondary graph represents the radiative forcing over two and a half centuries (history and projections). In the 5th IPCC report, the radiative forcing is 2.3 W/m2. The values of the forcing in 2100 gave their name to the IPCC scenarios (RCP 2.6, RCP 4.5 etc.). The colours of these scenarios can be found in the graphs of cards n° 5, 11, 15, 21, 22 and 24. For more details on this graph, see the fact sheet on PCR scenarios.
2Causes
Aerosols cool down the climate.
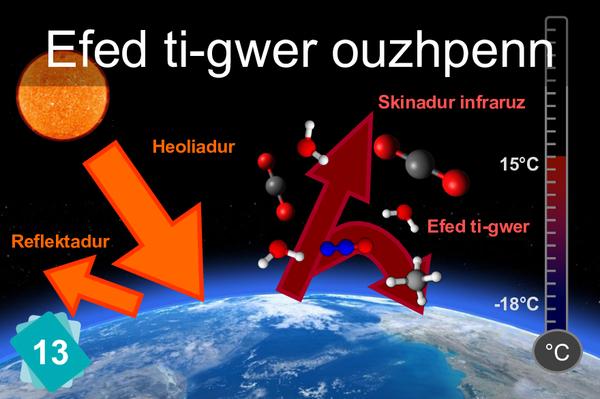
The expression "Greenhouse Effect" is written on both sides (as of last version, October 2018).


