11 - CO2 konsantrasyonu (ppm)
✏️ This explanation does not yet exist in your language. Please fill this Google Form if you want to help us!

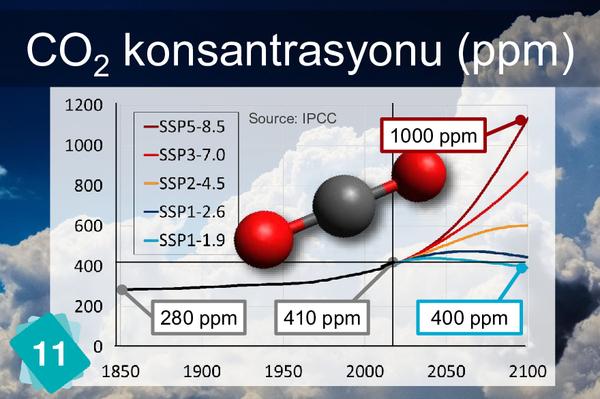
CO2 measurements have been taken since 1958 in Hawaii, on Big Island, on the flanks of the Mauna Loa volcano. They were initiated by Charles Keeling. In the blue scenario (2°C) they increase until 2040-2050, then they decrease because emissions will have been reduced so much that natural sinks no longer absorb them.

1
Cause

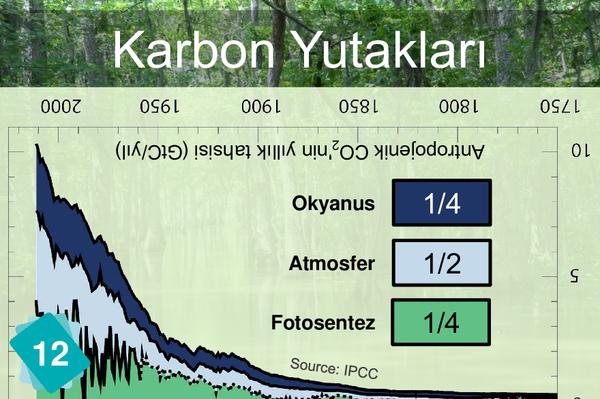
Karbon Yutakları

CO2 konsantrasyonu (ppm)

the card n11 represents the concentration in CO2, understood in the atmosphere (it's written behind the card).


1
Consequence

CO2 konsantrasyonu (ppm)

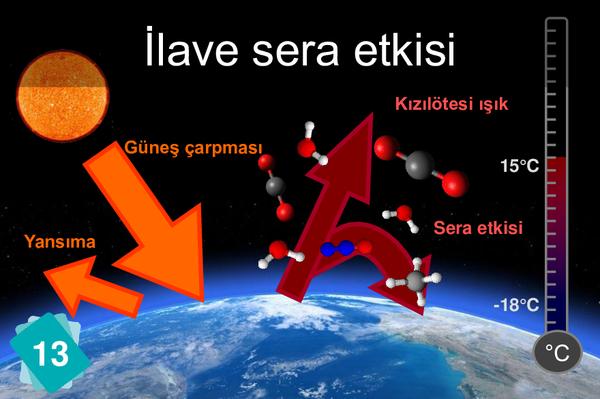
You can recognize the molecules of the different GHGs on the card 13 : H2O (red and white), CO2 (grey and red), CH4 (grey and white), nitrious (blue and red).


1
Wrong cause

CO2 konsantrasyonu (ppm)

Why not, but better link card 12 (Carbon sinks) to card 11. Card 12 is meant for that.


2
Wrong consequences

Karbon Yutakları

CO2 konsantrasyonu (ppm)

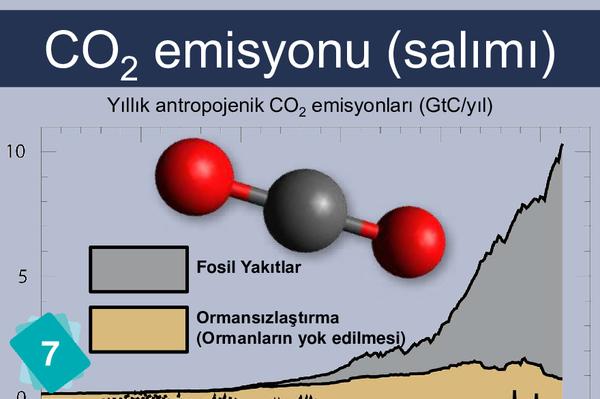
It can be argued that CO2 emissions take place before reaching carbon sinks. But the opposite link has our preference.


CO2 konsantrasyonu (ppm)

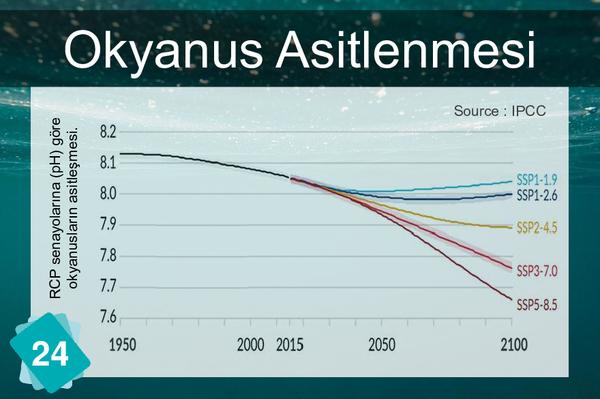
Players often identify CO2 concentration as a cause for ocean acidification. But it is more logical to link back to carbon sinks.