19 - Melting Ice Sheets

✏️ This explanation does not yet exist in your language. Please fill this Google Form if you want to help us!
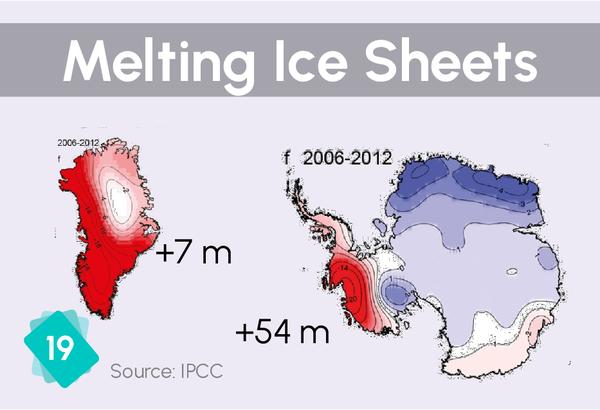
These illustrations represent the gain or loss of mass of the caps, indicated in centimetres of water per year (cm of water/year) and measured gravimetrically. In blue the mass gain (because it snows more) and in red the losses (glaciers flow faster towards the ocean).


