14 - Energiebilanz der Erde
✏️ Diese Erklärung ist in deiner Sprache noch nicht verfügbar, Hier klicken um deine Übersetzung vorzuschlagen oder schreibe eine E-Mail an fdc.memo@marc-antoinea.fr.
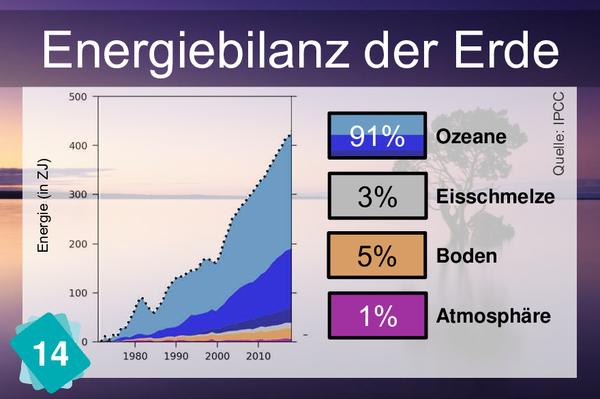
On the graph, you can see several colours that represent, from top to bottom: In light blue, the upper layer of the ocean, between 0 and 700m. In dark blue, the lower layer of the ocean, between 700m and 2000m In white, the different types of ice. In orange, the soil. In purple, the atmosphere. The dotted line represents the total.
2Ursachen
The text behind card n14 allows no ambiguity. Therefore the 2 cards have to be skipped together or not at all.
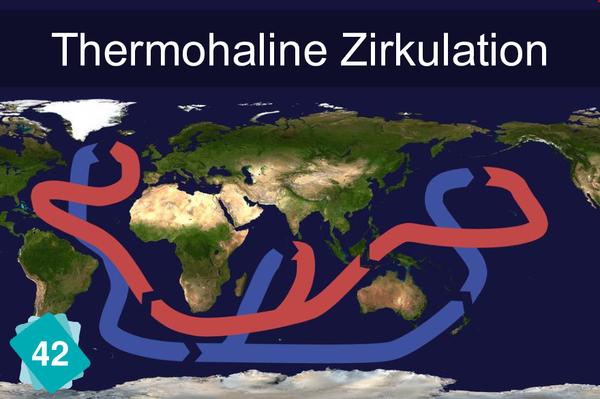
Heat is absorbed at the surface of the ocean. Thermohaline circulation helps mix watersurface and deep ocean which is essential to the absoption of energy by the ocean.
5Auswirkungen
1Andere mögliche Auswirkung
1Üngültige Ursache
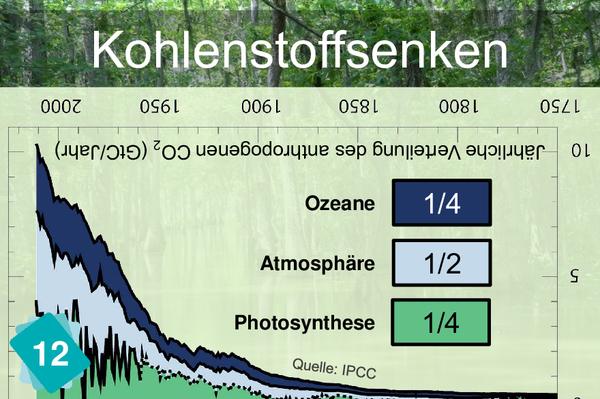
The idea here is not to say there is no link between these two cards, but to make sure they are not mixed up. The carbon sinks card tells us where the carbon goes. The energy budget card tells us where the excess energy goes. Both distribute something, but not the same thing. To make it even more confusing, the atmosphere and the ocean are present in both.


