14 - Balance energético
✏️ Esta explicación aún no está disponible en tu idioma, haz clic aquí para sugerir tu traducción o escribe un correo electrónico a fdc.memo@marc-antoinea.fr.
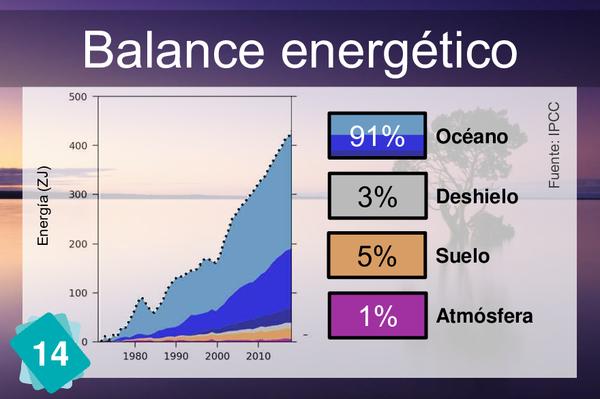
On the graph, you can see several colours that represent, from top to bottom: In light blue, the upper layer of the ocean, between 0 and 700m. In dark blue, the lower layer of the ocean, between 700m and 2000m In white, the different types of ice. In orange, the soil. In purple, the atmosphere. The dotted line represents the total.
2Causas
The text behind card n14 allows no ambiguity. Therefore the 2 cards have to be skipped together or not at all.
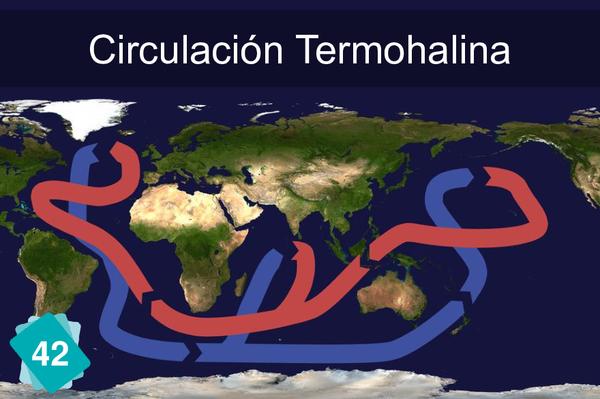
Heat is absorbed at the surface of the ocean. Thermohaline circulation helps mix watersurface and deep ocean which is essential to the absoption of energy by the ocean.
5Consecuencias
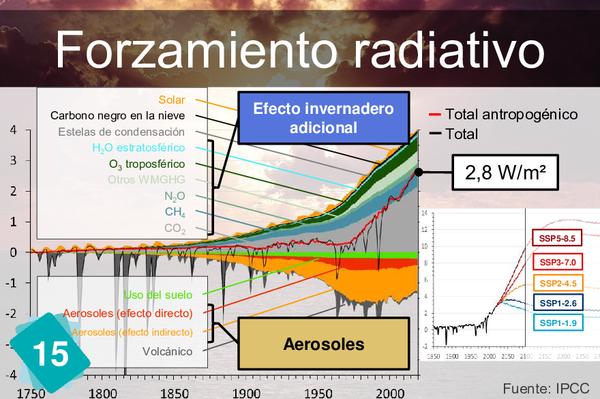
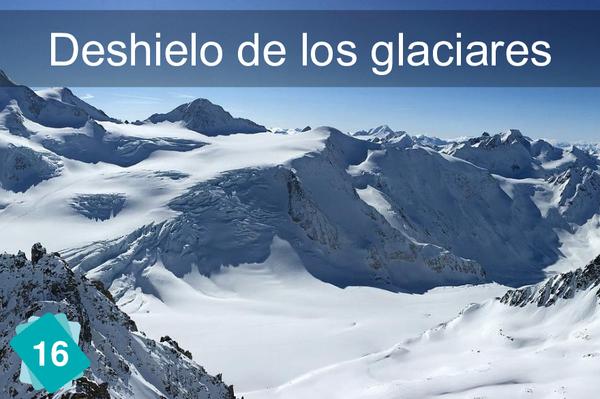
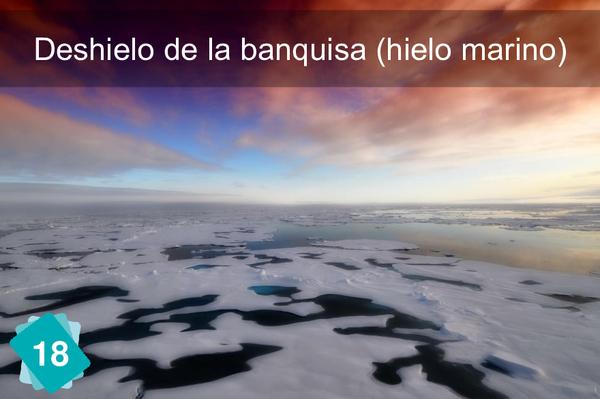
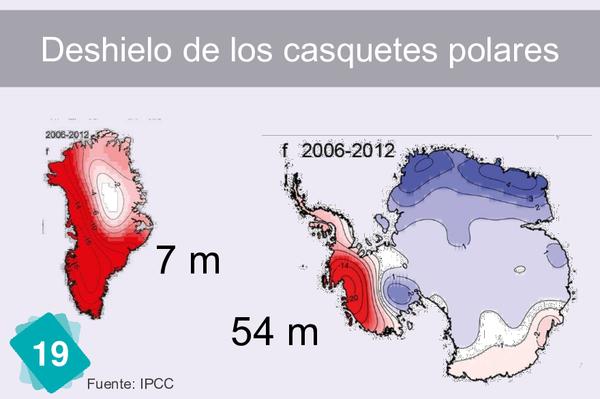
El efecto invernadero adicional provoca un forzamiento radiativo positivo. El excedente de energía se distribuye en el océano (93%), la vegetación (5%), el hielo (3%) y la atmósfera (1%). Esta energía calienta los diferentes compartimentos terrestres en los que se distribuye, aumentando sus temperaturas y, derritiendo os hielos. El hielo marino ártico ha perdido en superficie y en grosor. Está en su nivel más bajo desde hace 1000 años. En cambio, el hielo marino antártico no se derrite de manera significativa (alta variabilidad).
FUENTES: AR6 WG1 TS3.1 (balance energético) p59 (p93) // AR6 WG1 TS2.5 (derretimiento de los glaciares) p44 (p76) // AR6 WG1 Figura TS.13 (d) : balance energético p58 // AR6 WG1 Figura 9.13 : hielo marino ártico p1265 (p1248)
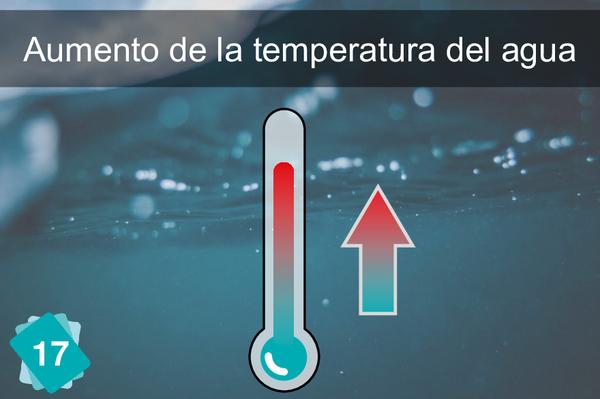
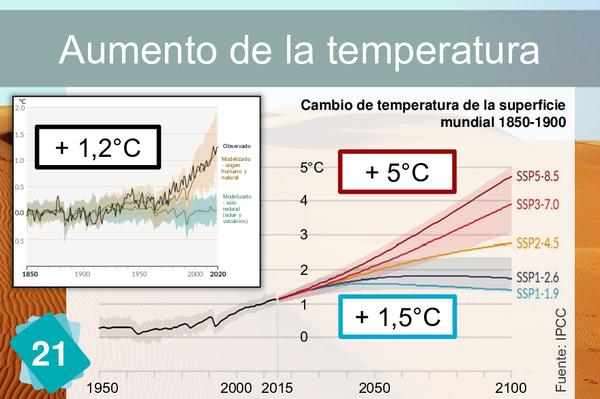
El efecto invernadero adicional provoca un forzamiento radiativo positivo. El exceso de energía se distribuye en el océano (93%), la vegetación (5%), el hielo (3%) y la atmósfera (1%). Esta energía calienta los distintos compartimentos terrestres en los que se distribuye, aumentando la temperatura y, derritiendo el hielo. La temperatura de la superficie (GMST) aumentó 1,09°C en 2019 en comparación con el período 1850-1900, 0,88°C en la superficie del océano (agua) en comparación con 1,59°C en la tierra (aire).
FUENTES: AR6 WG1 TS3.1 (balance energético) p59 (p93) // AR6 WG1 Cuadro de sección transversal TS.1 (océano + tierra) p29 (p60) // AR6 WG1 Cuadro de sección transversal TS.1, Figura 1 ( c): temperatura p29 (p61) // AR6 WG1 Figura 2.11 (c) p333 (p316)
1Otra consecuencia posible
1Causa incorrecta
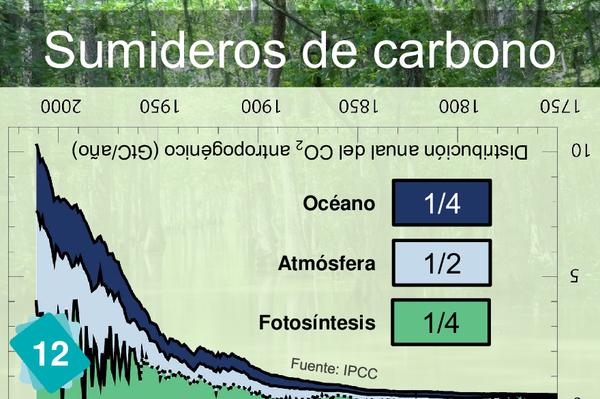
The idea here is not to say there is no link between these two cards, but to make sure they are not mixed up. The carbon sinks card tells us where the carbon goes. The energy budget card tells us where the excess energy goes. Both distribute something, but not the same thing. To make it even more confusing, the atmosphere and the ocean are present in both.


