7 - CO2-utslipp
✏️ This explanation does not yet exist in your language. Please fill this Google Form if you want to help us!
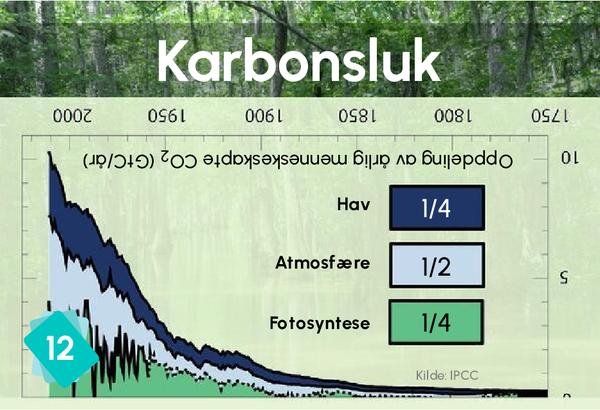
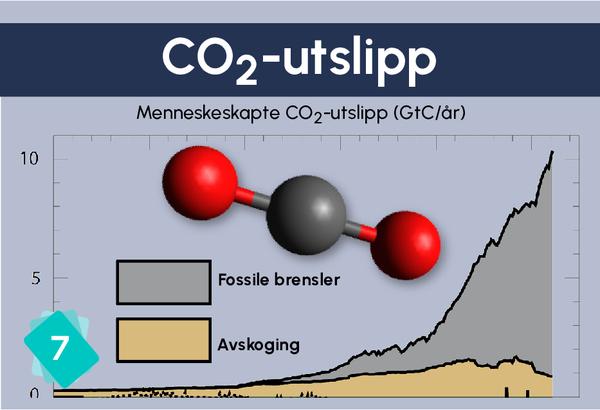
I brunt, utslipp knyttet til avskoging. I grått, utslipp knyttet til forbrenning av fossile brensler[1]. Den vertikale aksen er i Pg C/år (Peta gram karbon = 10^15 gram), som er det samme som Gt C/år (Giga tonn karbon per år). For å gjøre om til CO2, må man multiplisere med 3.67. Det spesielle med dette kortet er at det ikke er noen tidsskala. Dette kan virke som en ledetråd for å knytte det til karbonsluk-kortet (kort 12).
AR6 WG3 Figur TS.2 (a) // AR6 WG1 Figur 5.5 (a) s11 (s59) // s705 (s688) ↩︎
3Causes
1Consequence
These two cards can be put border-to-border in order to reconstitute the original graph. Ask the participants: "Have a look at card 12. What do you notice ? - It's written upside down - Exact. This is an enigma. The answer to it is on the table."
When they have found that 12 and 7 go together, then explain the resulting graph: it shows where the CO2 comes from and where it goes to. This is why the outer curves are symetricals. Each year, the CO2 emitted by Human beings has to go somewhere. If it's not in the carbon sinks, then it's in the atmosphere.
1Other possible cause
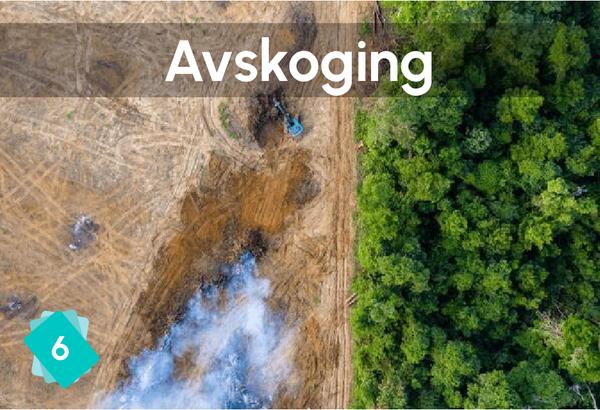
Agriculture does not emit much CO2 except from deforestation. Its carbon emissions mainly come from othe GHGs.


