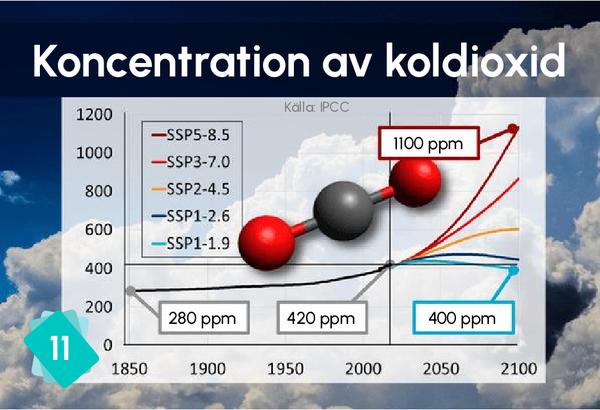
11 - Koncentration av koldioxid
✏️ Den här förklaringen är ännu inte tillgänglig på ditt språk, du kan fylla i detta Google-formulär för att hjälpa oss!
CO2-mätningar har pågått sedan 1958 på Hawaii på ön Big Island, på sluttningarna av vulkanen Mauna Loa. De startades av Charles Keeling har ge namn åt den berömda kurvan som är resultatet av hans arbete och som visar säsongsvariationerna i CO2-koncentration i atmosfären. Men trots denna säsongsvariation tog det honom bara två år att visa att den globala CO2-koncentration ökade[1].
1Orsak
Kortet nummer 11 representerar koncentrationen i CO2, i atmosfären (som det står skrivet på baksidan av kortet).
1Konsekvens
1Fel orsak
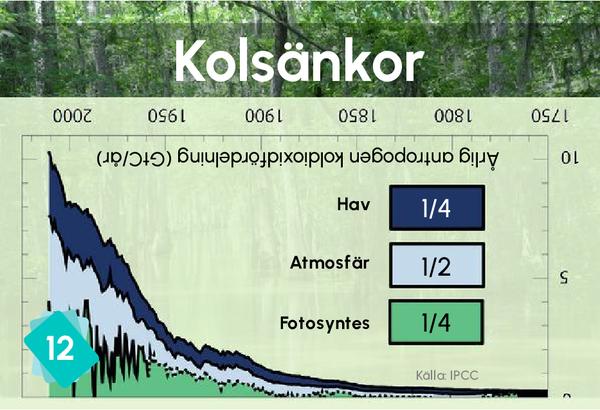
Varför inte, men det är bättre att länka kort 12 (Kolsänkor) till kort 11. Kort 12 är menat för det.


